Communication between modules
The introductory article on modules describes that Shiny modules have more than a few similarities with general R functions, albeit with some specific components related to Shiny. In addition, modules can range in complexity and often need to communicate with each other in large-scale applications. While a basic use of modules already helps manage complexity greatly, there are some useful techniques you can employ to ensure a smooth and clear model for communication between modules themselves and with your overall Shiny application. Following these best practices with modules enables your application’s code base to be more organized, easier to understand, and facilitate concurrent development workstreams on different components. In the remainder of this article, we will illustrate how these techniques are applied to a specific application utilizing modules.
Motivating Example
To illustrate these techniques, suppose we have a Shiny application that allows the user to visualize key variables within the Ames, Iowa housing data set (available via the AmesHousing R package).
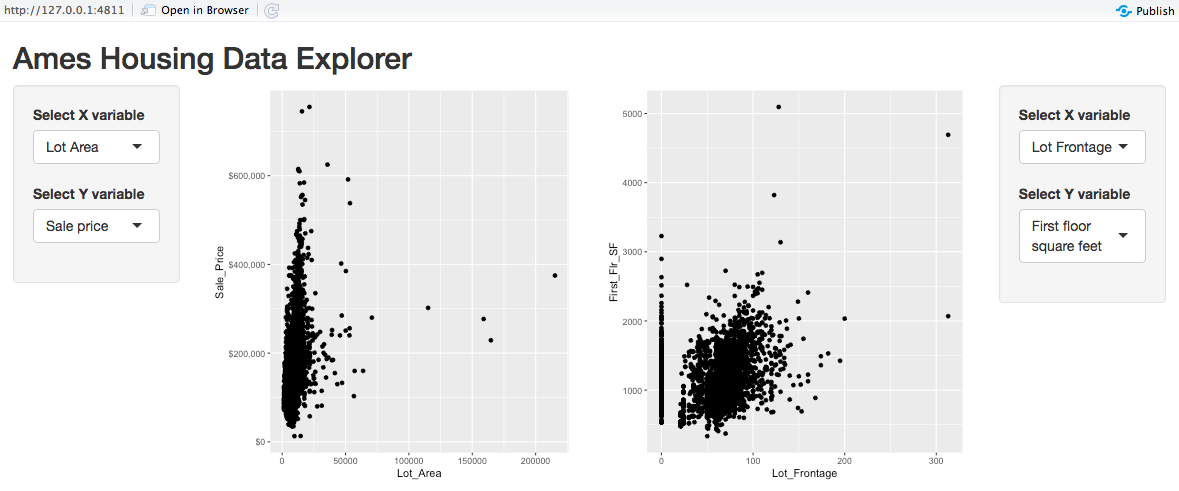
This application lets the user create two side-by-side scatterplots, each with potentially different variables selected for the X and Y axes. The app uses two modules, one handling the variable selection and the other producing the side-by-side scatterplots.
Module Documentation
Here is the variable selection module user interface:
#' Variable selection for plot user interface
#'
#' @param id, character used to specify namespace, see \code{shiny::\link[shiny]{NS}}
#'
#' @return a \code{shiny::\link[shiny]{tagList}} containing UI elements
varselect_mod_ui <- function(id) {
  ns <- NS(id)

  # define choices for X and Y variable selection
  var_choices <- list(
    `Sale price` = "Sale_Price",
    `Total basement square feet` = "Total_Bsmt_SF",
    `First floor square feet` = "First_Flr_SF",
    ...
  )

  # assemble UI elements
  tagList(
    selectInput(
      ns("xvar"),
      "Select X variable",
      choices = var_choices,
      selected = "Lot_Area"
    ),
    selectInput(
      ns("yvar"),
      "Select Y variable",
      choices = var_choices,
      selected = "Sale_Price"
    )
  )
}
Notice the use of roxygen comments before the varselect_mod_ui module definition. Writing documentation of a module’s inputs and return values is a powerful way to make clear the purpose of the module. Even if you use a different format for documenting the module parameters, the key point is to document when possible!
Return Values
Now let’s examine the server logic of this module:
#' Variable selection module server-side processing
#'
#' @param input, output, session standard \code{shiny} boilerplate
#'
#' @return list with following components
#' \describe{
#'   \item{xvar}{reactive character string indicating x variable selection}
#'   \item{yvar}{reactive character string indicating y variable selection}
#' }
varselect_mod_server <- function(input, output, session) {

  return(
    list(
      xvar = reactive({ input$xvar }),
      yvar = reactive({ input$yvar })
    )
  )
}
The purpose of the server-side component is to assemble the variable choices made by the user, and the return object is a named list with slots corresponding to the different variable selections. While the processing of this module is trivial (i.e. nothing more than obtaining the input values), constructing the return value in this manner is a straight-forward approach to articulating the intent. In this case, the module acts like an accessor to capture the inputs explicitely. Lastly, this module reinforces the idea that reactive expressions are typically the most portable format for passing reactive information between modules.
Communication between modules
Below is the server logic of the visualization module. This module makes use of a simple function, scatter_sales(), to create the scatterplot. Details on this function as well as the module that builds the user interface for the visualization (scatterplot_mod_ui) are shown in the app code, but omitted here.
#' Scatterplot module server-side processings
#'
#' This module produces a scatterplot with the sales price against a variable selected by the user.
#'
#' @param input,output,session standard \code{shiny} boilerplate
#' @param dataset data frame (non-reactive) with variables necessary for scatterplot
#' @param plot1_vars list containing reactive x-variable name (called `xvar`) and y-variable name (called `yvar`) for plot 1
#' @param plot2_vars list containing reactive x-variable name (called `xvar`) and y-variable name (called `yvar`) for plot 2
scatterplot_server_mod <- function(input,
                            output,
                            session,
                            dataset,
                            plot1vars,
                            plot2vars) {


  plot1_obj <- reactive({
    p <- scatter_sales(dataset, xvar = plot1vars$xvar(), yvar = plot1vars$yvar())
    return(p)
  })

  plot2_obj <- reactive({
    p <- scatter_sales(dataset, xvar = plot2vars$xvar(), yvar = plot2vars$yvar())
    return(p)
  })

  output$plot1 <- renderPlot({
    plot1_obj()
  })

  output$plot2 <- renderPlot({
    plot2_obj()
  })
}
We can now see the benefits of documenting the variable module’s parameters and clear specification of the return object. The documentation for the plot1vars and plot2vars parameters indicates the object type and more importantly the reactive components of the x and y variable names. Within the module code, it is important to reference the variable names correctly by using plot1vars$yvar() instead of plot1vars()$yvar, which is a common error in these situations.
Application structure
Below is the user interface and server code for the application overall. Complete code including module definitions and helper functions can be found alongside the deployed app here.
# user interface
ui <- fluidPage(

  titlePanel("Ames Housing Data Explorer"),

  fluidRow(
    column(
      width = 2,
      wellPanel(
        varselect_mod_ui("plot1_vars")
      )
    ),
    column(
      width = 8,
      scatterplot_mod_ui("plots")
    ),
    column(
      width = 2,
      wellPanel(
        varselect_mod_ui("plot2_vars")
      )
    )
  )
)

# server logic
server <- function(input, output, session) {

  # prepare dataset
  ames <- make_ames()

  # execute plot variable selection modules
  plot1vars <- callModule(varselect_mod_server, "plot1_vars")
  plot2vars <- callModule(varselect_mod_server, "plot2_vars")

  # execute scatterplot module
  res <- callModule(scatterplot_mod_server,
                    "plots",
                    dataset = ames,
                    plot1vars = plot1vars,
                    plot2vars = plot2vars)

}

# Run the application
shinyApp(ui = ui, server = server)
By utilizing the techniques illustrated above, the application wrapper code is well-organized and easy to manage. The module for selecting variables could easily be called multiple times, and any enhancements made to that module could be performed in parallel to other development workstreams. For instance, if a team of developers was authoring this application, a subset of the team may improve the plot aesthetics in the scatterplot module while another group tweaks the variable selection module appearance. In addition, the documentation of the module inputs and return values ensures clear communication of the purpose of the module and can even be incorporated in new applications or packages.