Overview

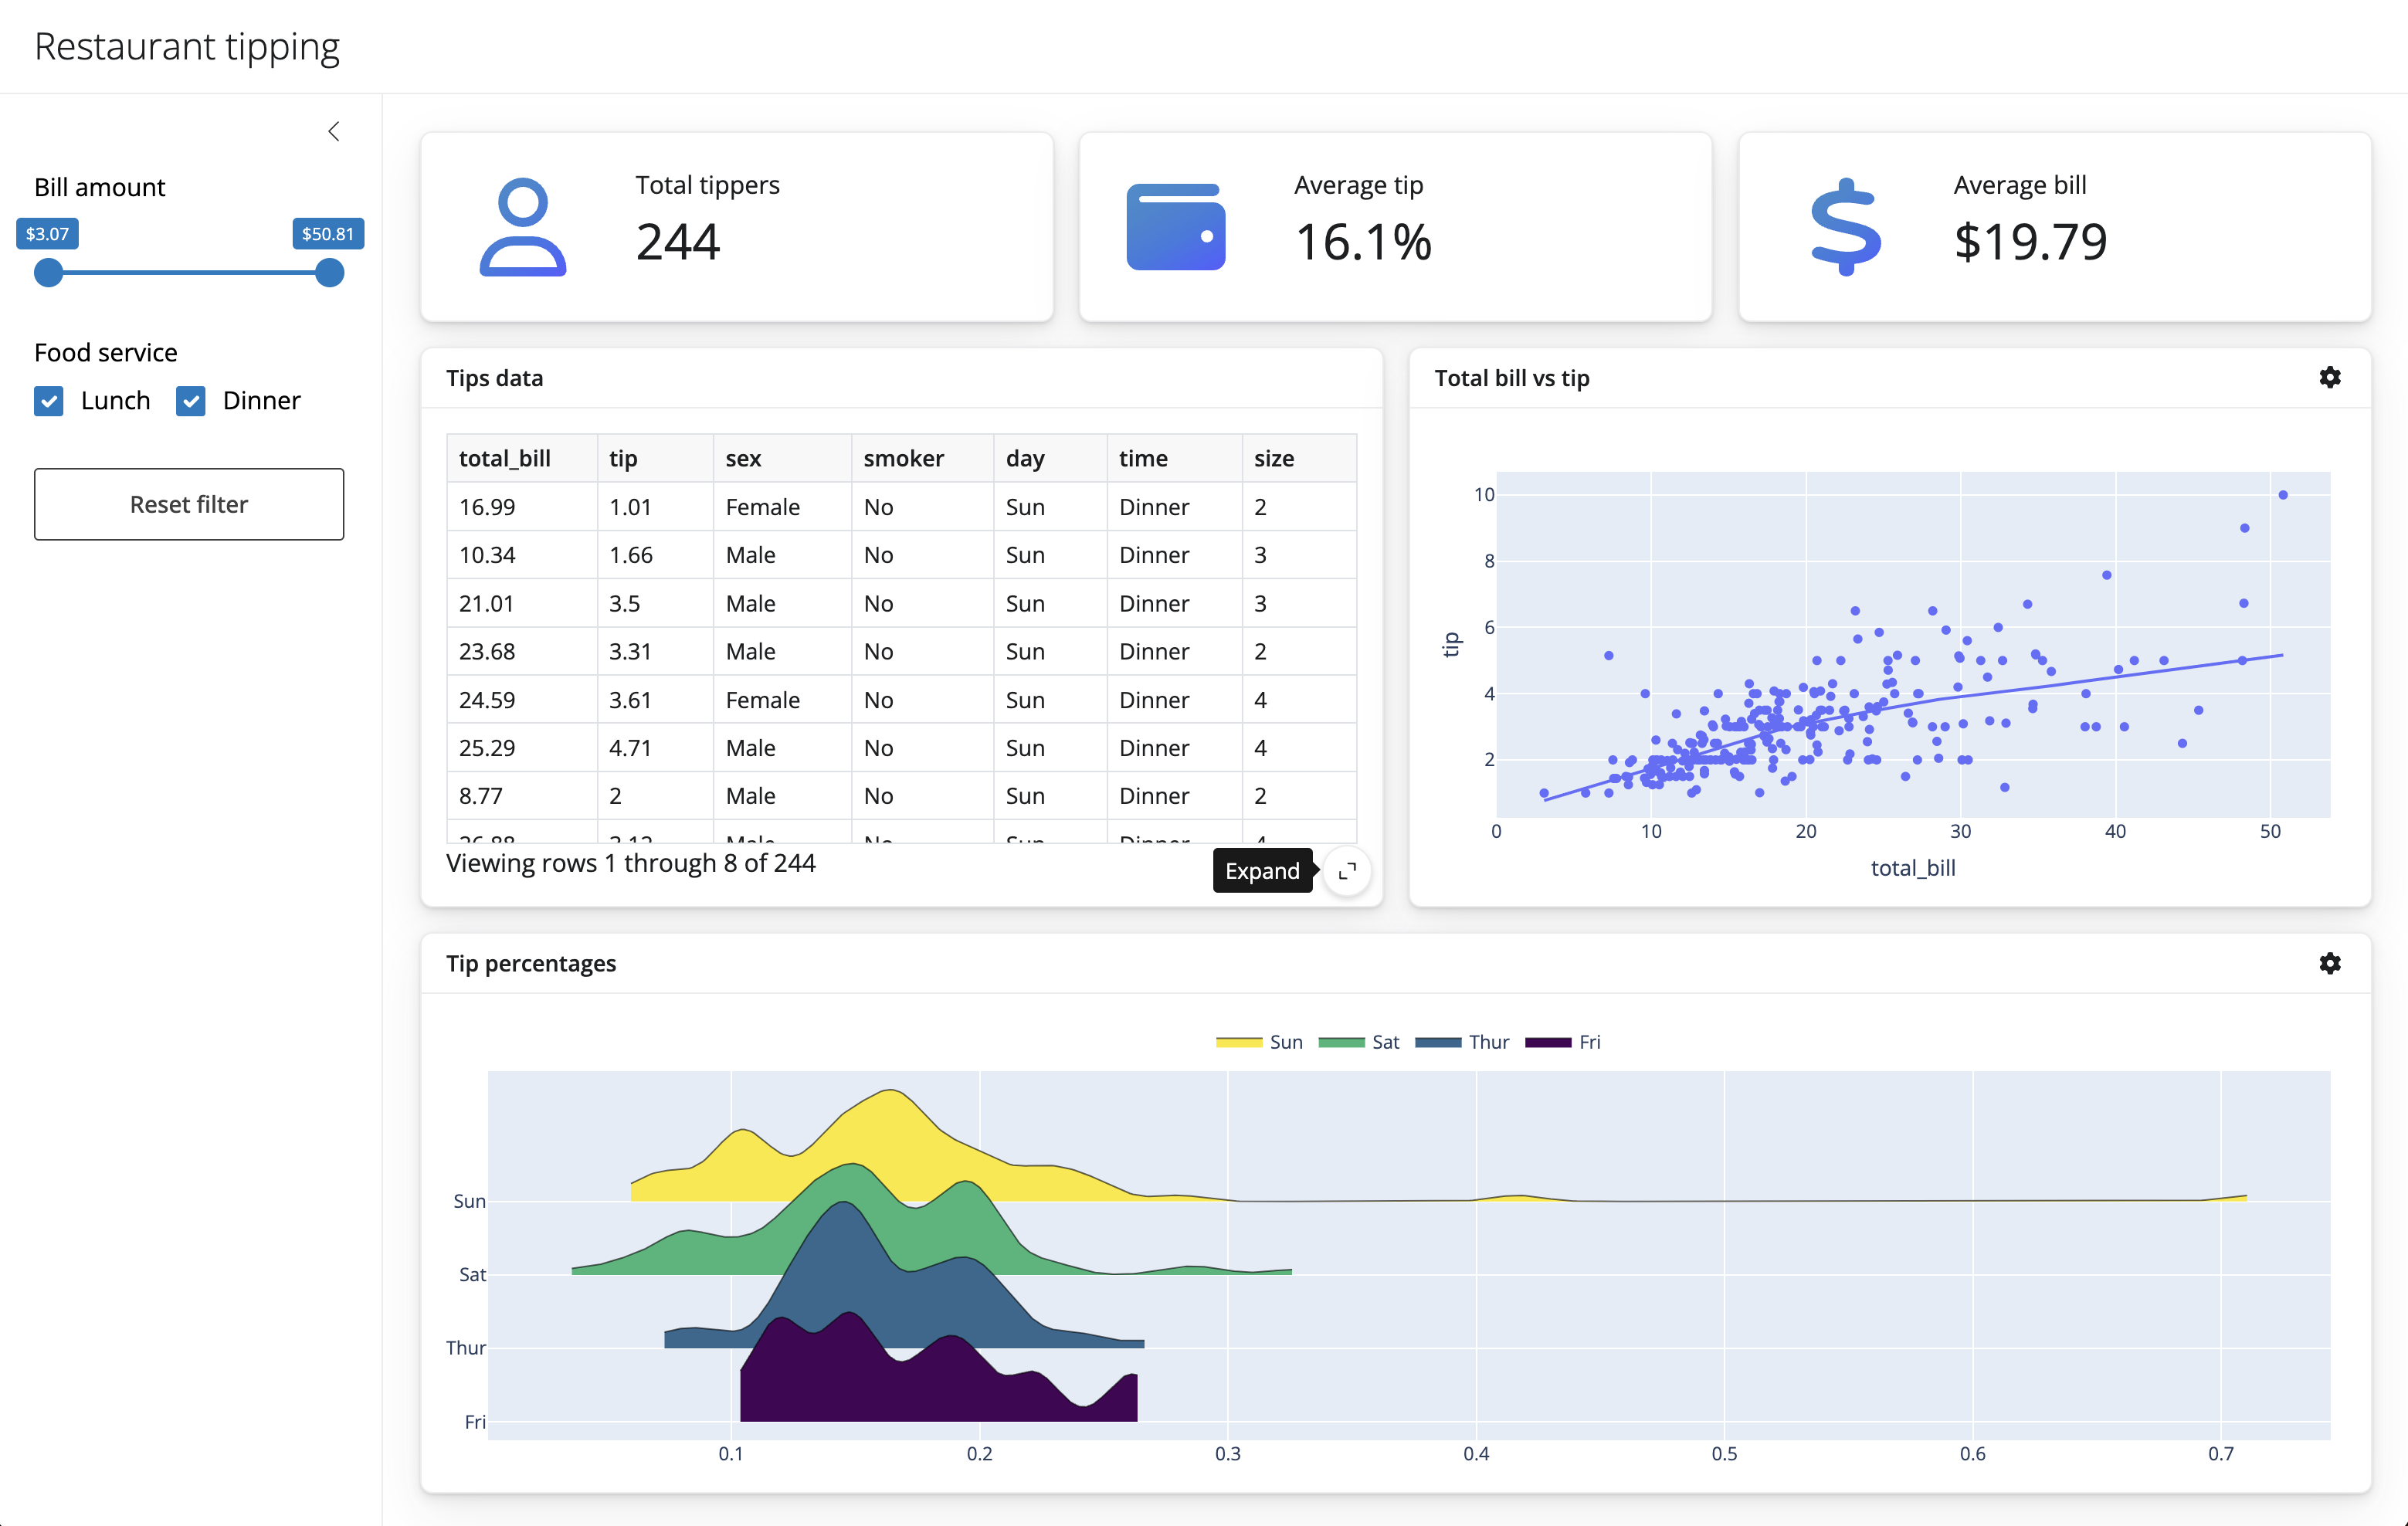
Welcome to the learn Shiny overview! Here we’ll introduce Shiny’s capabilities and link to articles where you can learn more. In the next article, we’ll cover more user interface (UI) components by building this dashboard:

A Shiny dashboard with visuals for exploring restaurant tips (covered in the next article).
Editable examples

Many examples on this site have a code editor for modifying the source code for a Shiny app (which runs entirely in the browser, thanks to shinylive). If you’d like to run any examples locally, first install and run Shiny locally, then copy/paste relevant code into the app.py file (created by shiny create).

Basics

Shiny apps typically start with input components to gather information from a user, which are then used to reactively render output components. Here’s a basic example that displays a slider’s value as formatted text.

#| standalone: true
#| components: [editor, viewer]
#| layout: vertical
#| viewerHeight: 150
from shiny.express import input, render, ui

ui.input_slider("val", "Slider label", min=0, max=100, value=50)

@render.text
def slider_val():
    return f"Slider value: {input.val()}"

This example demonstrates the basic mechanics behind Shiny apps:

  • Inputs are created via ui.input_*() functions.
    • The first argument is the input’s id, which is used to read the input’s value.
  • Outputs are created by decorating a function with @render.*.
    • Inside a render function, input values can be read reactively.
    • When those input values change, Shiny knows how to minimally re-render output.
  • This example happens to use shiny.express which, compared to core Shiny, reduces the amount of code required.

Components

Shiny includes many useful user interface (ui) components for creating inputs, outputs, displaying messages, and more. For brevity sake, we’ll highlight just a few output and layout components here, but for a more comprehensive list, see the components gallery.

Outputs

Shiny makes it easy to create dynamic plots, tables, and other interactive widgets. All you need to do is apply a @render decorator to a function that returns a suitable object. Shiny includes a wide variety of these decorators in its render module, but Shiny extensions like shinywidgets provide additional decorators for rendering other kinds of outputs, like Jupyter Widgets.

To include a plot in an application, apply @render.plot to a function that creates a matplotlib visual. Note that packages like seaborn, plotnine, pandas, etc., are all compatible (as long as they create a matplotlib visual).

#| standalone: true
#| components: [editor, viewer]
#| layout: vertical
#| viewerHeight: 480

from shiny.express import input, render, ui

ui.input_selectize(
    "var", "Select variable",
    choices=["bill_length_mm", "body_mass_g"]
)

@render.plot
def hist():
    from matplotlib import pyplot as plt
    from palmerpenguins import load_penguins

    df = load_penguins()
    df[input.var()].hist(grid=False)
    plt.xlabel(input.var())
    plt.ylabel("count")

## file: requirements.txt
palmerpenguins

Apply @render.data_frame to any code that returns a pandas DataFrame for a basic table. For more sophisticated tables, you can use render.DataGrid to add things like filters to your table.

#| standalone: true
#| components: [editor, viewer]
#| layout: vertical
#| viewerHeight: 480

from shiny.express import input, render, ui

ui.input_selectize(
    "var", "Select variable",
    choices=["bill_length_mm", "body_mass_g"]
)

@render.data_frame
def head():
    from palmerpenguins import load_penguins
    df = load_penguins()
    return df[["species", input.var()]]
## file: requirements.txt
palmerpenguins

See the Jupyter Widgets article for more information on rendering Jupyter Widgets in Shiny.

#| standalone: true
#| components: [editor, viewer]
#| layout: vertical
#| viewerHeight: 480

from shiny.express import input, ui
from shinywidgets import render_altair
import soft_dependencies

ui.input_selectize(
    "var", "Select variable",
    choices=["bill_length_mm", "body_mass_g"]
)

@render_altair
def hist():
    import altair as alt
    from palmerpenguins import load_penguins
    df = load_penguins()
    return alt.Chart(df).mark_bar().encode(
        x=alt.X(f"{input.var()}:Q", bin=True),
        y="count()"
    )
## file: requirements.txt
altair
anywidget
palmerpenguins
jsonschema
## file: soft_dependencies.py
# Temporary workaround to inform shinylive of soft dependencies
import anywidget
import jsonschema
import mypy_extensions
import toolz
#| standalone: true
#| components: [editor, viewer]
#| layout: vertical
#| viewerHeight: 480

from shiny.express import input, ui
from shinywidgets import render_bokeh

ui.input_selectize(
    "var", "Select variable",
    choices=["bill_length_mm", "body_mass_g"]
)

@render_bokeh
def hist():
    from bokeh.plotting import figure
    from palmerpenguins import load_penguins

    p = figure(x_axis_label=input.var(), y_axis_label="count")
    bins = load_penguins()[input.var()].value_counts().sort_index()
    p.quad(
        top=bins.values,
        bottom=0,
        left=bins.index - 0.5,
        right=bins.index + 0.5,
    )
    return p
## file: requirements.txt
bokeh
jupyter_bokeh
xyzservices
#| standalone: true
#| components: [editor, viewer]
#| layout: vertical
#| viewerHeight: 480

from shiny.express import input, ui
from shinywidgets import render_plotly

ui.input_selectize(
    "var", "Select variable",
    choices=["bill_length_mm", "body_mass_g"]
)

@render_plotly
def hist():
    import plotly.express as px
    from palmerpenguins import load_penguins
    df = load_penguins()
    return px.histogram(df, x=input.var())

## file: requirements.txt
palmerpenguins
plotly
#| standalone: true
#| components: [editor, viewer]
#| layout: vertical
#| viewerHeight: 480

import pydeck as pdk
import shiny.express
from shinywidgets import render_pydeck

@render_pydeck
def map():
    UK_ACCIDENTS_DATA = "https://raw.githubusercontent.com/visgl/deck.gl-data/master/examples/3d-heatmap/heatmap-data.csv"

    layer = pdk.Layer(
        "HexagonLayer",  # `type` positional argument is here
        UK_ACCIDENTS_DATA,
        get_position=["lng", "lat"],
        auto_highlight=True,
        elevation_scale=50,
        pickable=True,
        elevation_range=[0, 3000],
        extruded=True,
        coverage=1,
    )

    # Set the viewport location
    view_state = pdk.ViewState(
        longitude=-1.415,
        latitude=52.2323,
        zoom=6,
        min_zoom=5,
        max_zoom=15,
        pitch=40.5,
        bearing=-27.36,
    )

    # Combined all of it and render a viewport
    return pdk.Deck(layers=[layer], initial_view_state=view_state)
## file: requirements.txt
pydeck

Many other awesome Python packages provide widgets that are compatible with Shiny. In general, you can render them by applying the @render_widget decorator.

import shiny.express
from shinywidgets import render_widget

@render_widget
def widget():
    # Widget code goes here
    ...

Layouts

Shiny provides a full suite of layout components which help with arranging multiple inputs and outputs in a variety of ways. As seen below, with shiny.express, layout components (e.g., ui.sidebar()) can be used as context managers to help with nesting and readability.

#| standalone: true
#| components: [editor, viewer]
#| layout: vertical
#| viewerHeight: 350
import plotly.express as px
from shiny.express import input, render, ui
from shinywidgets import render_widget

ui.page_opts(title="Sidebar layout", fillable=True)

with ui.sidebar():
    ui.input_select("var", "Select variable", choices=["total_bill", "tip"])

@render_widget
def hist():
    return px.histogram(px.data.tips(), input.var())

## file: requirements.txt
pandas
#| standalone: true
#| components: [editor, viewer]
#| layout: vertical
#| viewerHeight: 350

import plotly.express as px
from shiny.express import input, render, ui
from shinywidgets import render_widget

ui.page_opts(title="Multi-page example", fillable=True)

with ui.sidebar():
    ui.input_select("var", "Select variable", choices=["total_bill", "tip"])

with ui.nav_panel("Plot"):
    @render_widget
    def hist():
        return px.histogram(px.data.tips(), input.var())

with ui.nav_panel("Table"):
    @render.data_frame
    def table():
        return px.data.tips()

## file: requirements.txt
pandas
#| standalone: true
#| components: [editor, viewer]
#| layout: vertical
#| viewerHeight: 350

import plotly.express as px
from shiny.express import input, render, ui
from shinywidgets import render_widget

ui.page_opts(title="Multi-tab example", fillable=True)

with ui.sidebar():
    ui.input_select("var", "Select variable", choices=["total_bill", "tip"])

with ui.navset_card_underline(title="Penguins"):
    with ui.nav_panel("Plot"):
        @render_widget
        def hist():
            return px.histogram(px.data.tips(), input.var())

    with ui.nav_panel("Table"):
        @render.data_frame
        def table():
            return px.data.tips()

## file: requirements.txt
pandas
#| standalone: true
#| components: [editor, viewer]
#| layout: vertical
#| viewerHeight: 350
import plotly.express as px
from shiny.express import input, render, ui
from shinywidgets import render_widget

ui.page_opts(title="Multi-column example")

ui.input_select("var", "Select variable", choices=["total_bill", "tip"])

with ui.layout_columns(height="300px"):
    @render_widget
    def hist():
        return px.histogram(px.data.tips(), input.var())

    @render.data_frame
    def table():
        return px.data.tips()

## file: requirements.txt
pandas
Quarto integration

Shiny also integrates well with Quarto, allowing you to leverage its web-based output formats (e.g., dashboards) in combination with Shiny outputs and reactivity.

Reactivity

Shiny uses something called transparent reactivity to automatically infer relationships between components, and minimally re-render as needed when dependencies change.1 As a result, apps naturally retain performance as they grow in size, without workarounds like caching or memoization. All Shiny apps are also built on the same small set of reactive foundations, each of which are simple and easy to learn, but can be combined in novel ways to create seriously sophisticated and performant apps.

To demonstrate how Shiny minimally re-renders, consider the following app which contains two different plots, each of which depends on a different input. When the first input changes, Shiny knows to only re-render the first plot, and vice versa.

#| standalone: true
#| components: [editor, viewer]
#| layout: vertical
#| viewerHeight: 325
import plotly.express as px
from shiny.express import input, render, ui
from shinywidgets import render_plotly

tips = px.data.tips()

with ui.layout_columns():
    @render_plotly
    def plot1():
        p = px.histogram(tips, x=input.var1())
        p.update_layout(height=200, xaxis_title=None)
        return p

    @render_plotly
    def plot2():
        p = px.histogram(tips, x=input.var2())
        p.update_layout(height=200, xaxis_title=None)
        return p

with ui.layout_columns():
    ui.input_select("var1", None, choices=["total_bill", "tip"], width="100%")
    ui.input_select("var2", None, choices=["tip", "total_bill"], width="100%")
## file: requirements.txt
palmerpenguins
plotly
pandas

Shiny also knows when outputs are visible or not, and so, will only call render functions when needed. For example, in the app below, the table function doesn’t get called until the “Table” page is selected.

#| standalone: true
#| components: [editor, viewer]
#| layout: vertical
#| viewerHeight: 325
import plotly.express as px
from shiny.express import input, render, ui
from shinywidgets import render_plotly

tips = px.data.tips()

with ui.sidebar():
    ui.input_selectize("var", "Select variable", choices=["total_bill", "tip"])

ui.nav_spacer()

with ui.nav_panel("Plot"):
    @render_plotly
    def plot():
        p = px.histogram(tips, x=input.var())
        p.update_layout(height=225)
        return p

with ui.nav_panel("Table"):
    @render.data_frame
    def table():
        return tips[[input.var()]]
## file: requirements.txt
palmerpenguins
plotly
pandas
Learn more

For a more in-depth look at reactivity, check out the reactivity article.

Starter templates

Once you’ve installed Shiny, the shiny create CLI command provides access to a collection of useful starter templates. This command walks you through a series of prompts to help you get started quickly with a helpful example. One great option is the dashboard template, which can be created with:

shiny create -t dashboard

The resulting dashboard generated by the dashboard template
Development workflow

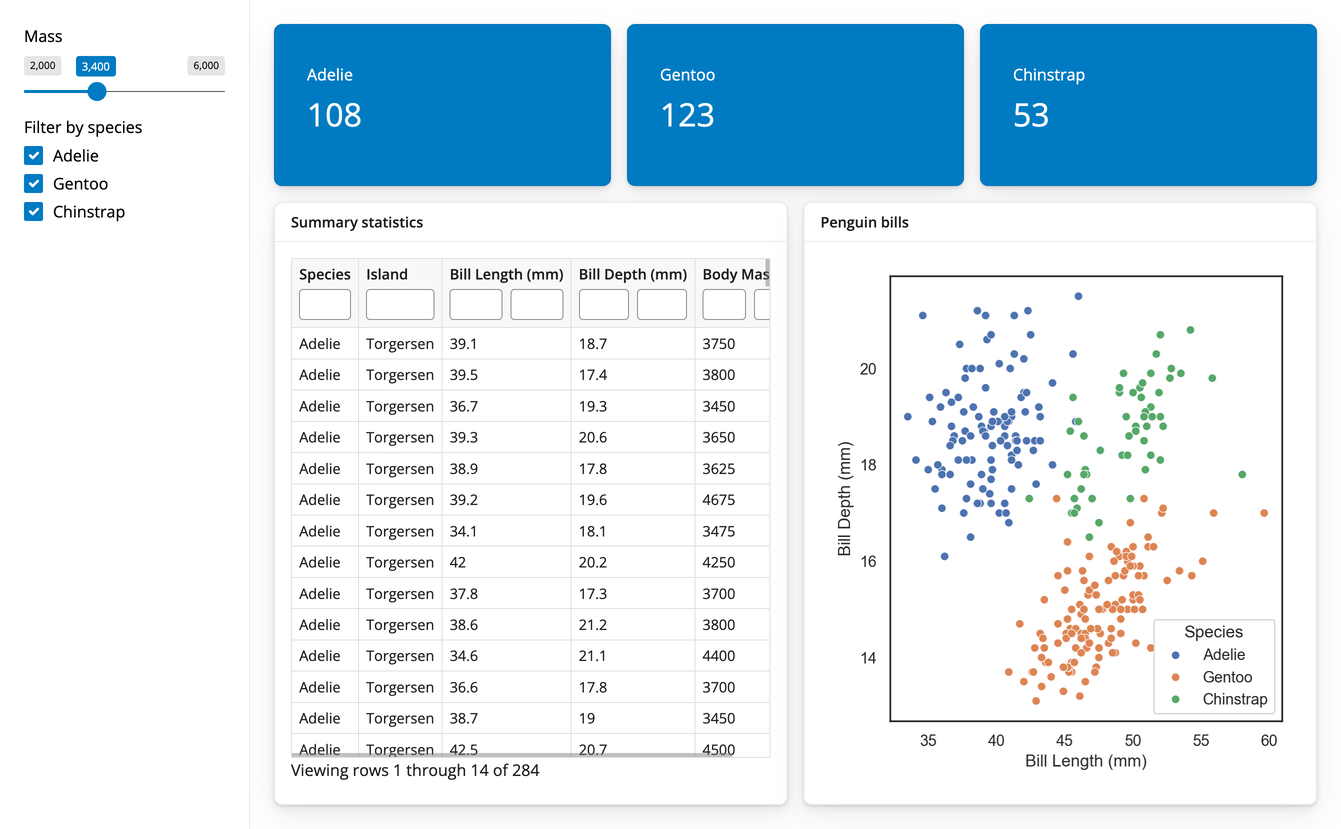
See the workflow section for more information developing Shiny apps locally. Also keep in mind you can develop apps in the browser using the playground.

Extensible foundation

Shiny is built on a foundation of web standards, allowing you to incrementally adopt custom HTML, CSS, and/or JavaScript as needed. In fact, Shiny UI components themselves are built on a Python representation of HTML/CSS/JavaScript, which you can see by printing them in a Python REPL:

>>> from shiny import ui
>>> ui.input_action_button("btn", "Button")
<button class="btn btn-default action-button" id="btn" type="button">Button</button>

And, since UI is HTML, you can gently introduce HTML/CSS/JavaScript as needed in your apps to customize without having to learn complicated build tooling and frameworks. However, if you’re versed in web programming, you can also use Shiny to create custom components that leverage your favorite JavaScript framework from Python.

Next steps

Next, we’ll learn more about Shiny components and layouts by making a dashboard.

Footnotes

  1. If you’re familiar with JavaScript, you may find a lot of similarities between Shiny and reactivity in modern JS frameworks like solidjs, mobx, and svelte.↩︎