Gallery
Welcome to the Shiny Gallery! Below you can find a myriad of Shiny apps to be inspired by and to learn from. We have organized the apps in two main categories:
Feature Demos
Shiny Demos are a series of apps created by the Shiny developers and are designed to highlight specific features of the shiny package. Each app is presented along with its source code to help you implement these features in your apps. Many of these apps are linked from relevant articles as well.
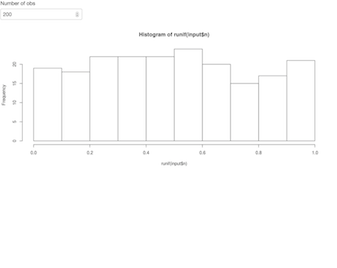
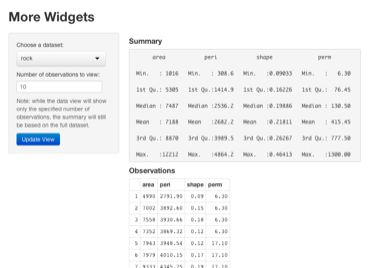
Start Simple
If you’re new to Shiny, these simple but complete applications are designed for you to learn from.
No matching items
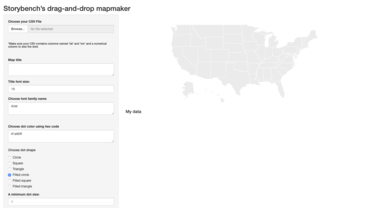
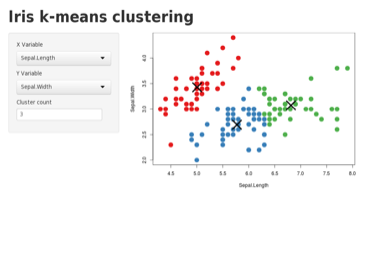
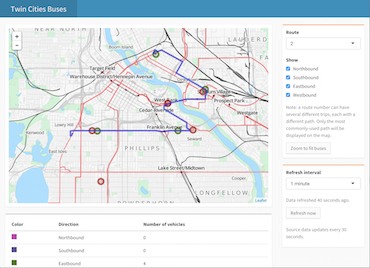
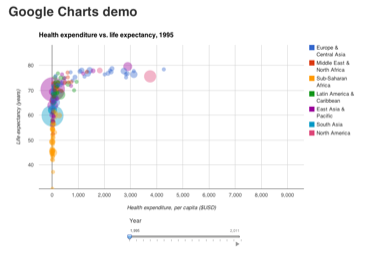
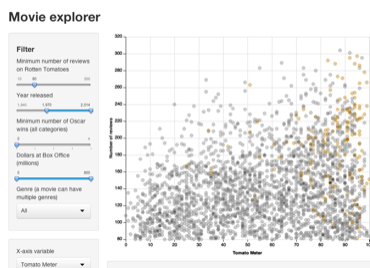
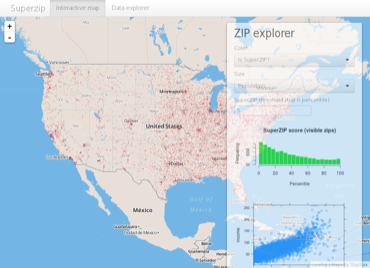
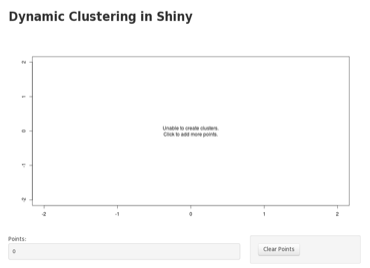
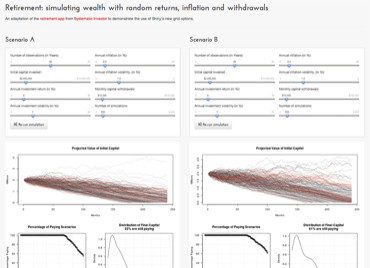
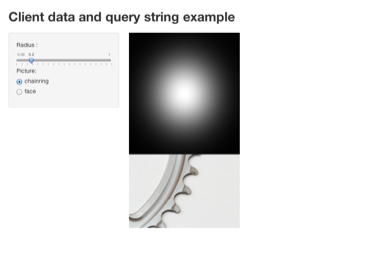
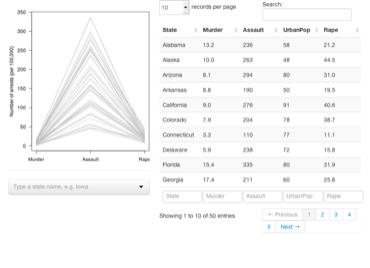
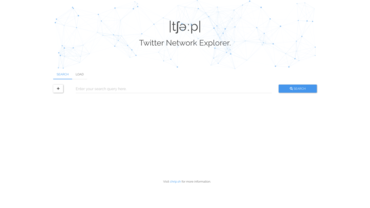
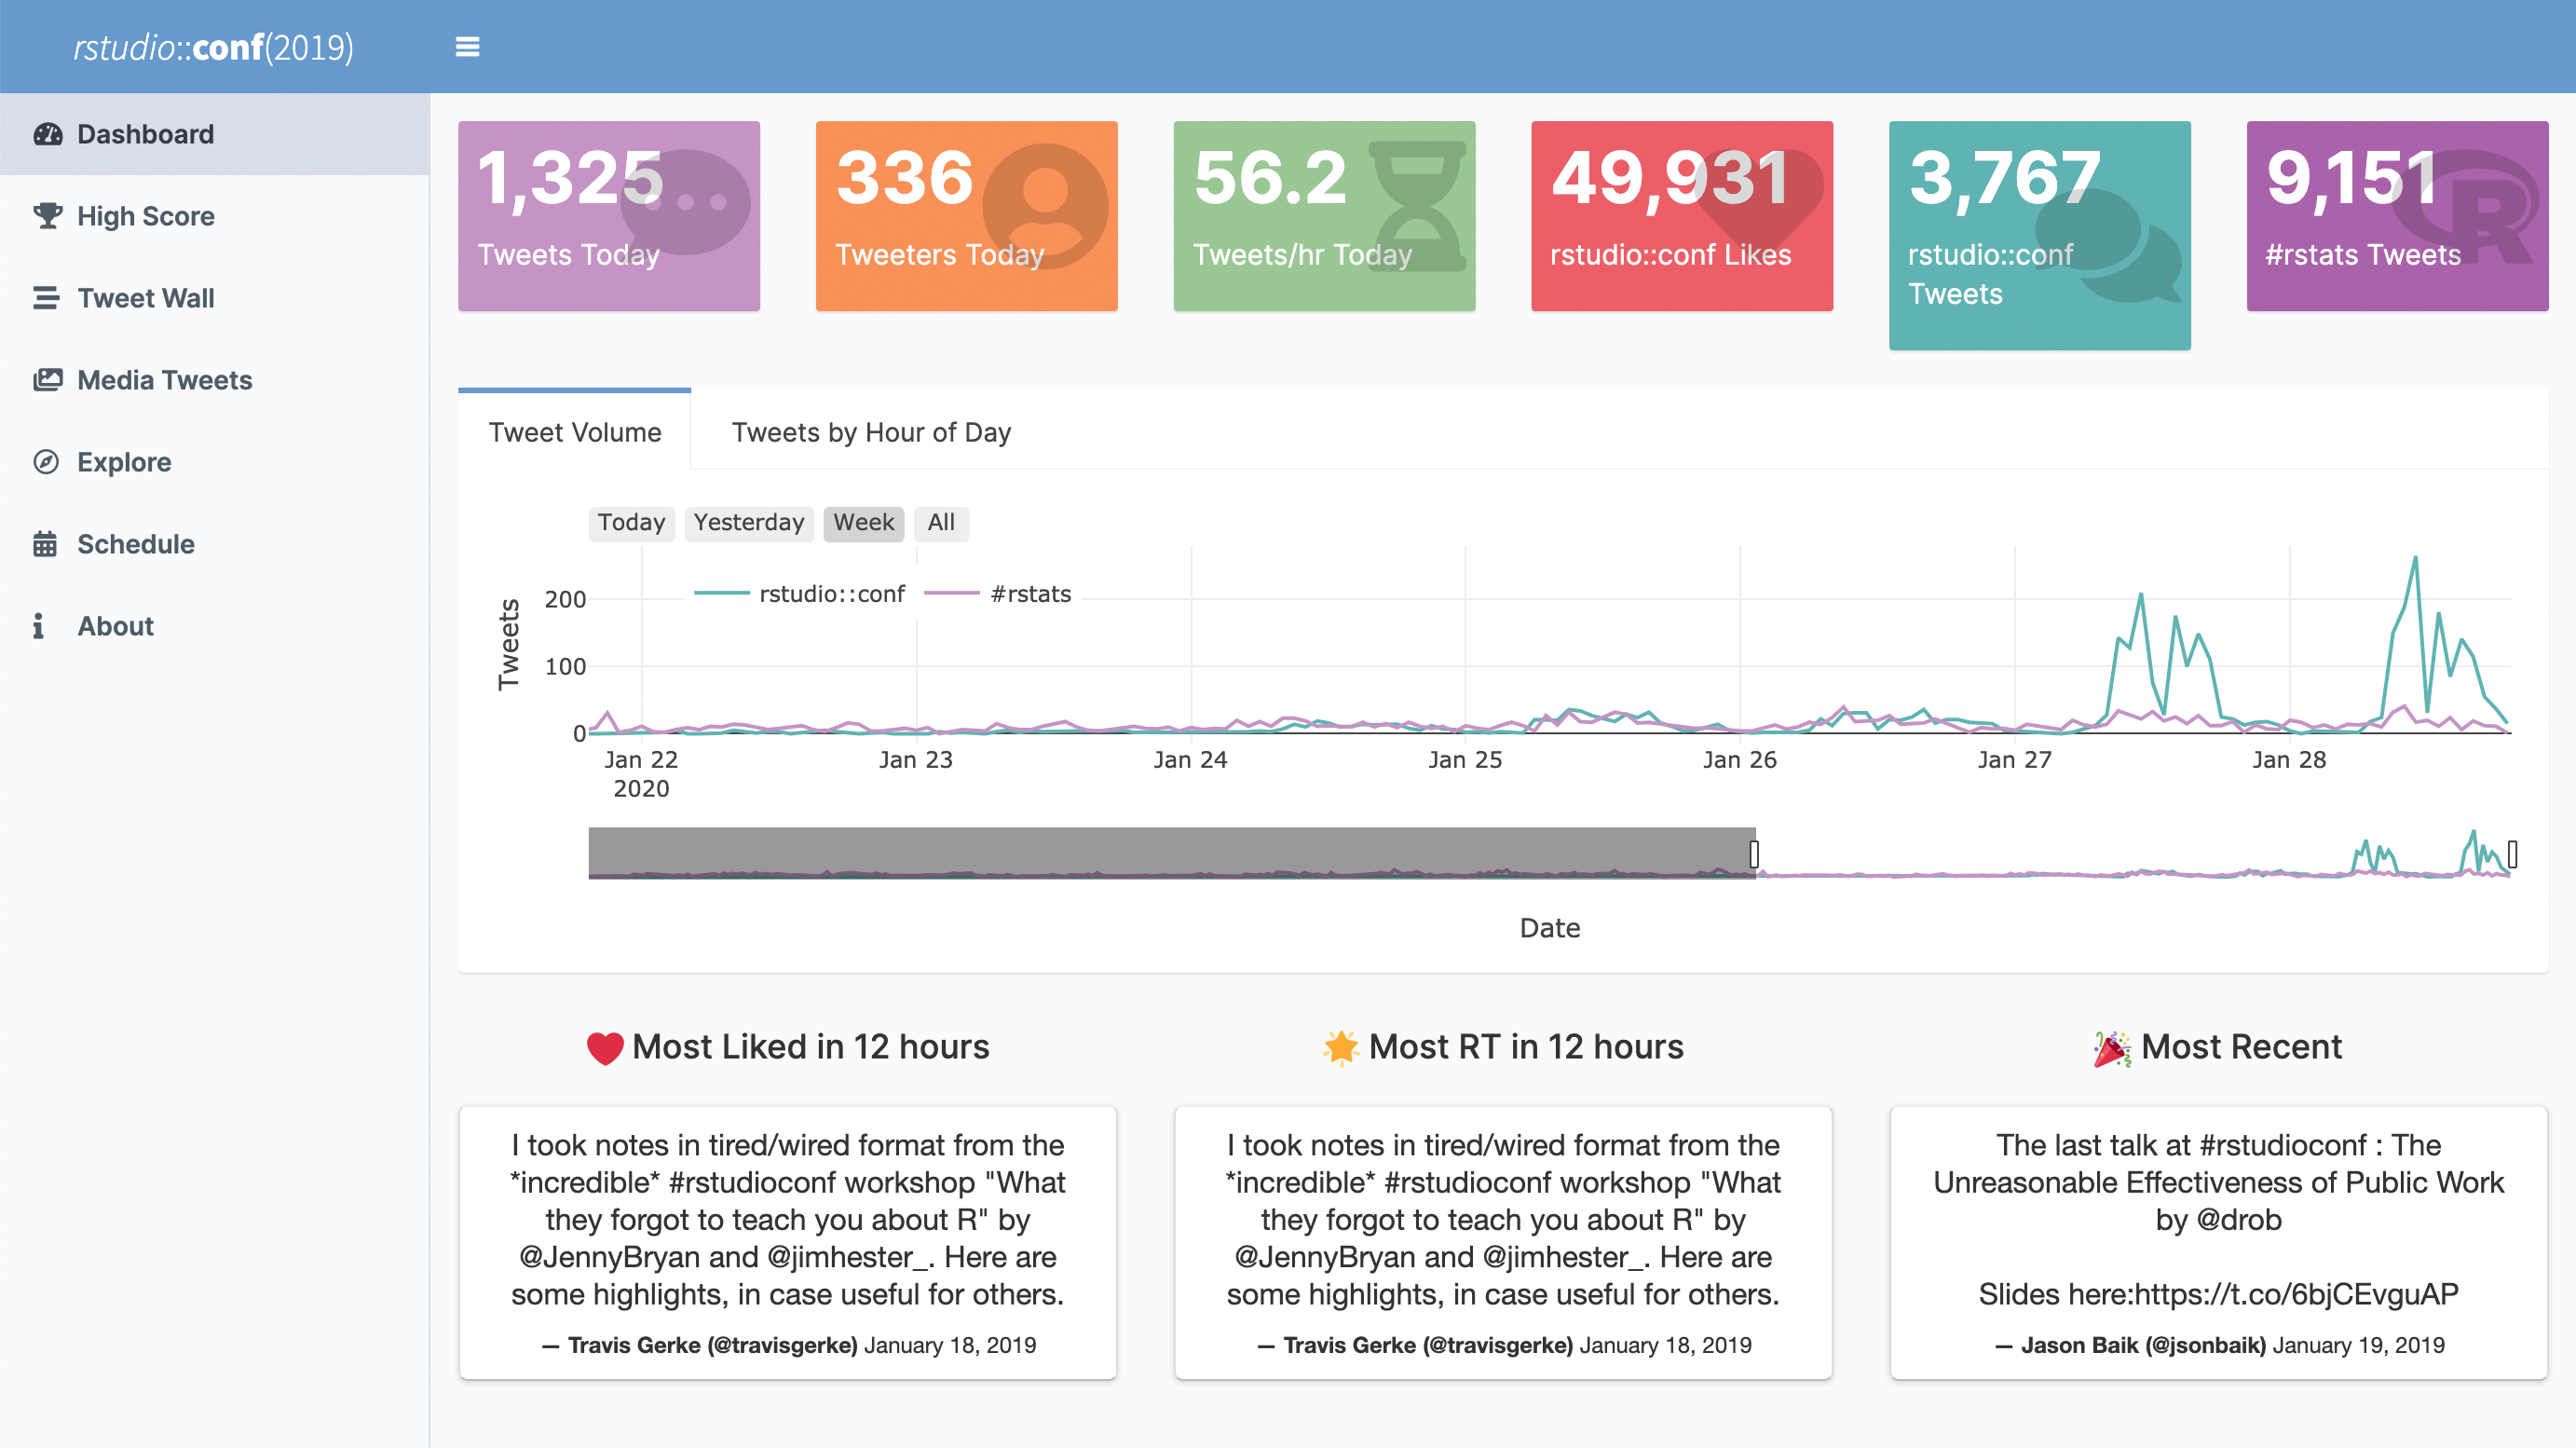
Interactive visualizations
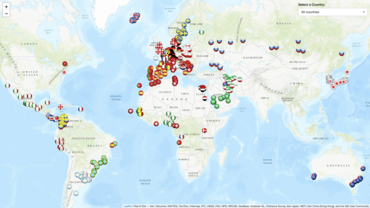
Shiny is designed for fully interactive visualization, using JavaScript libraries like d3, Leaflet, and Google Charts.
No matching items
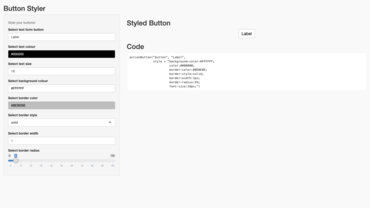
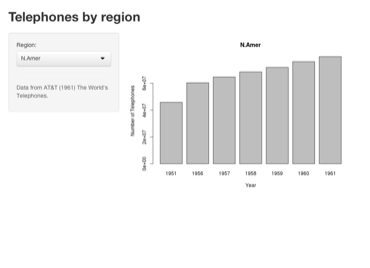
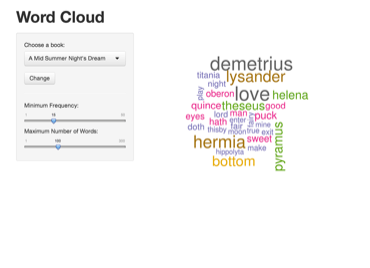
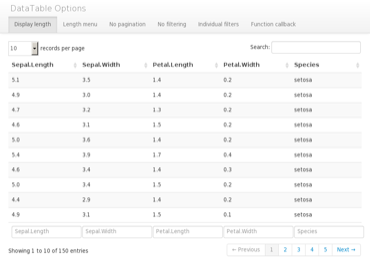
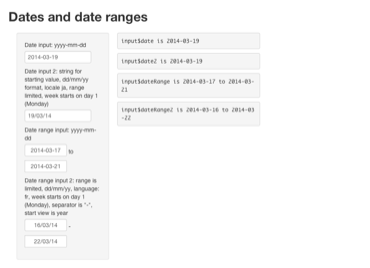
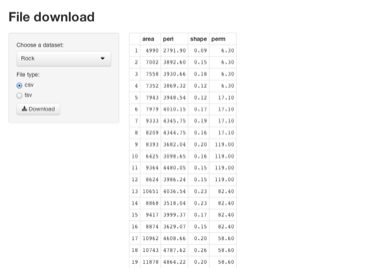
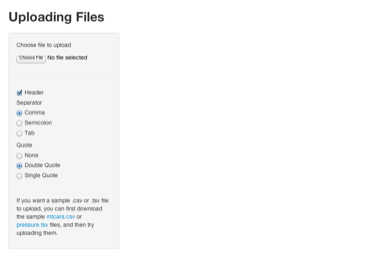
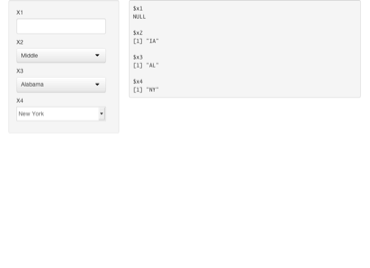
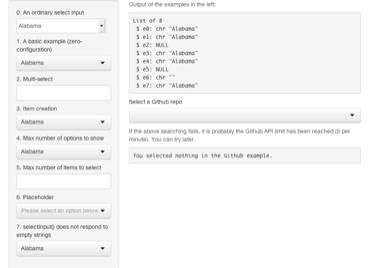
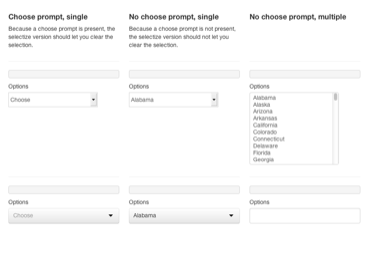
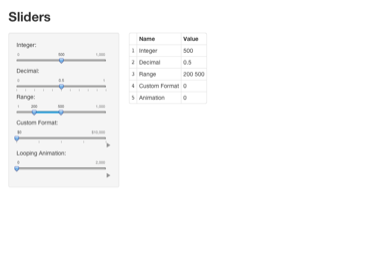
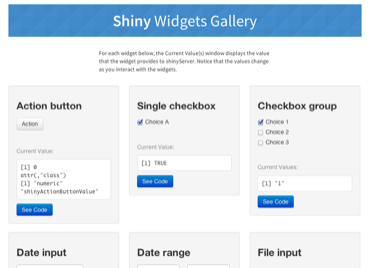
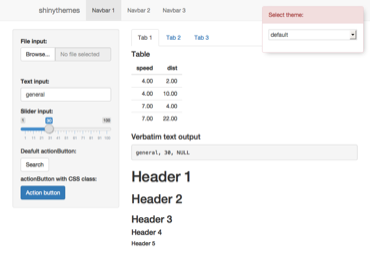
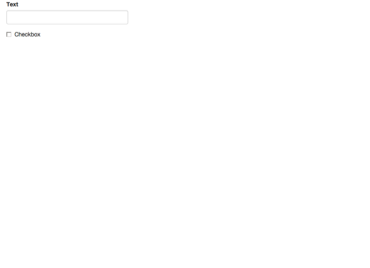
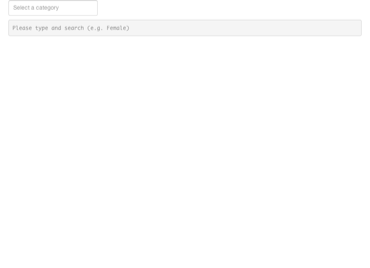
Widgets
Get to know many of the input and output widgets that are available in Shiny with these examples.

No matching items
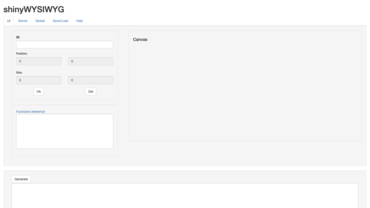
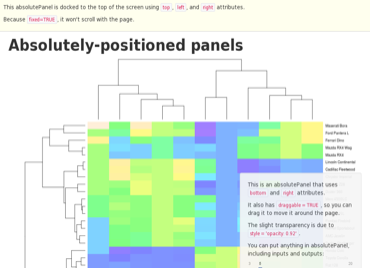
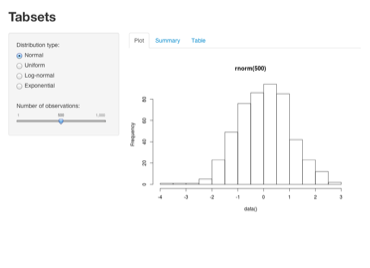
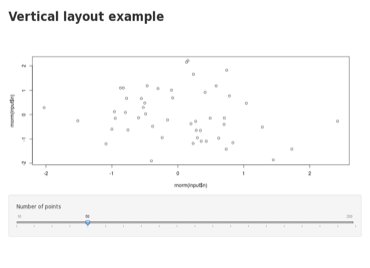
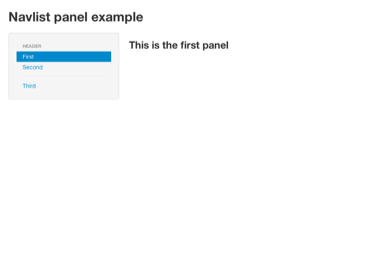
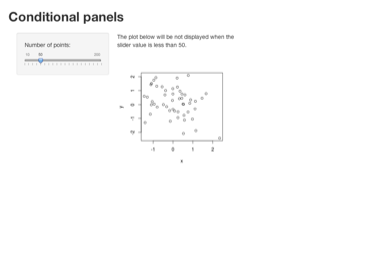
Application layout
Each example in this category demonstrates one or more of the functions you can use to organize app UI.
No matching items
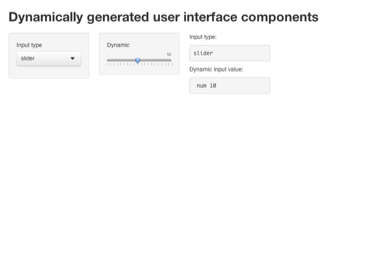
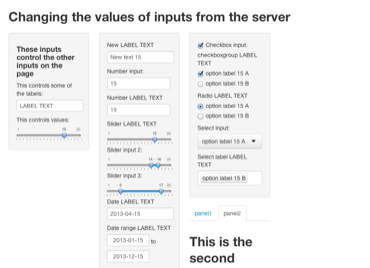
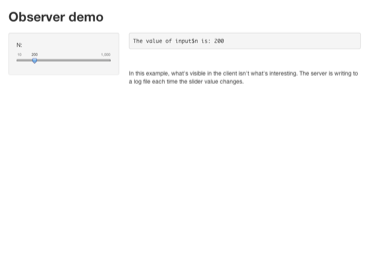
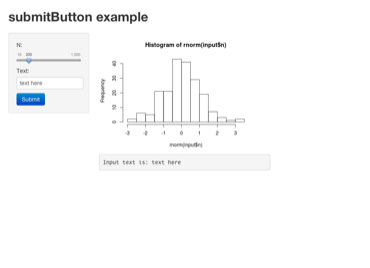
Dynamic user interface
These examples show how to create a user interface that changes dynamically.
No matching items
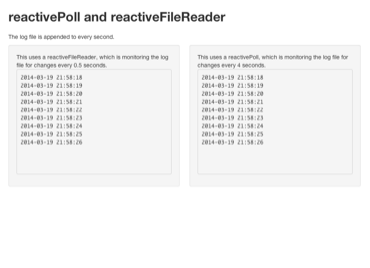
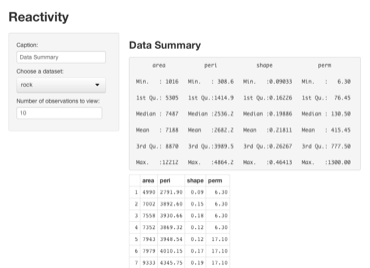
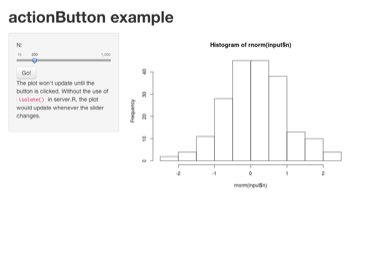
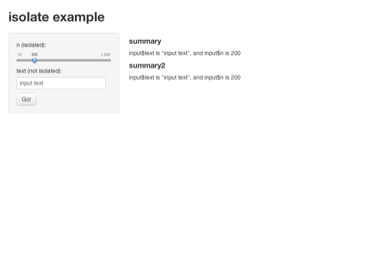
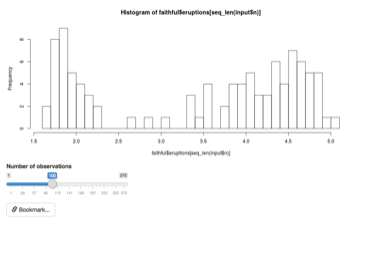
Reactive programming
These examples illustrate some useful features and idioms of Shiny’s reactive programming framework.

No matching items
Advanced Shiny
These examples show how to extend Shiny and use advanced features.

No matching items
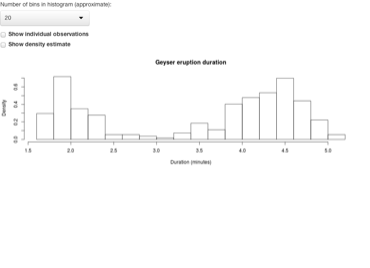
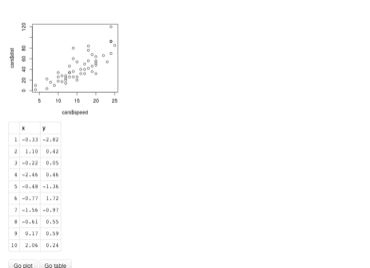
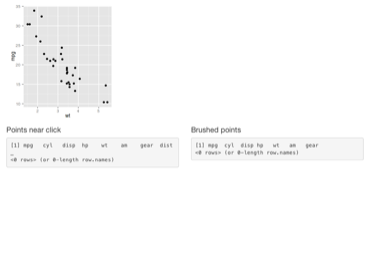
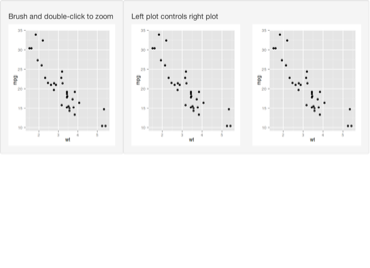
Interactive plots
These examples show how to use Shiny’s interactive plotting features
No matching items
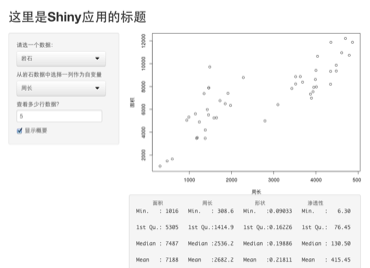
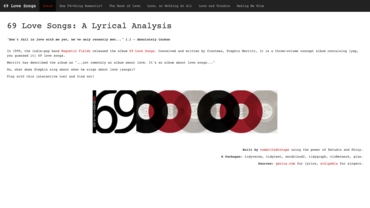
Internationalization
Include multi-byte characters in Shiny apps.
No matching items
User Showcase
The Shiny User Showcase is comprised of contributions from the Shiny app developer community. The apps are categorized into application areas and presented with a brief description, tags, and for many, the source code. Note that many of these apps are winners and honorable mentions of our annual Shiny contest!
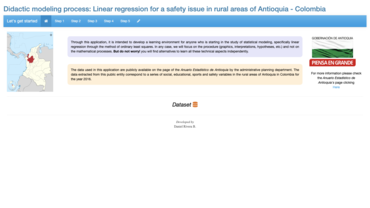
Education
Apps designed for teaching
No matching items
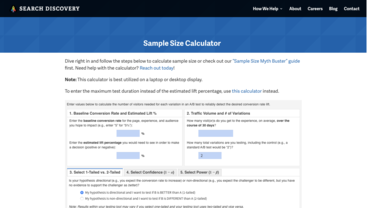
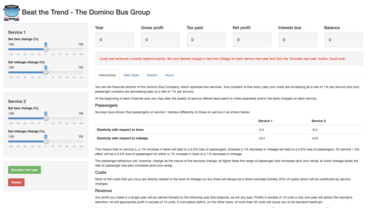
Finance Banking


No matching items
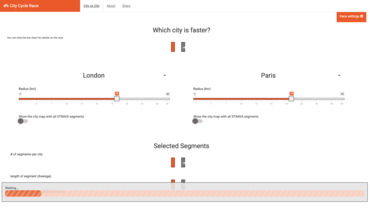
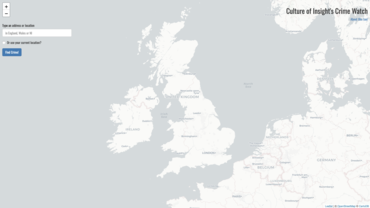
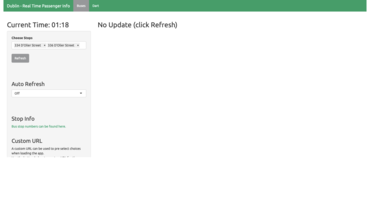
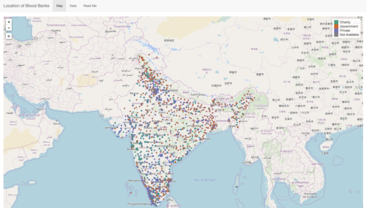
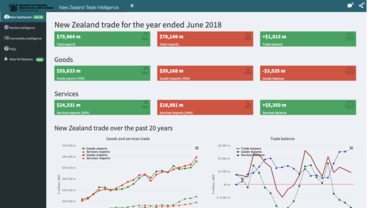
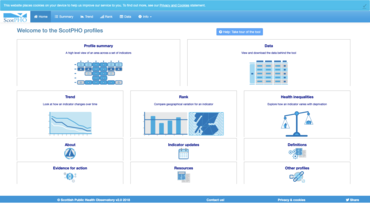
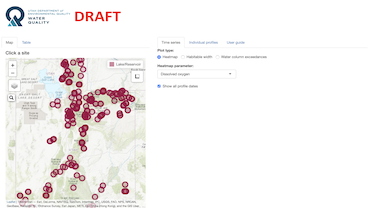
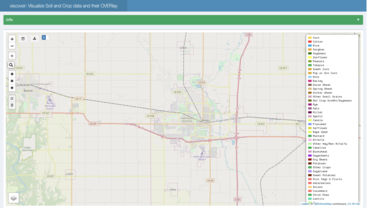
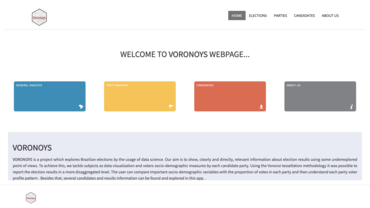
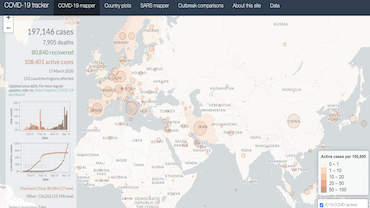
Government Public Sector
Mostly open data


No matching items
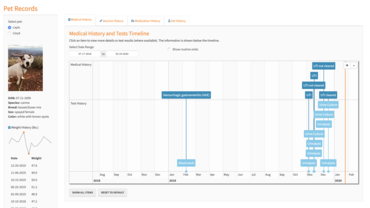
Life Sciences
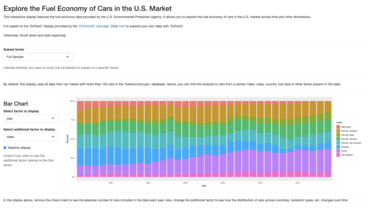
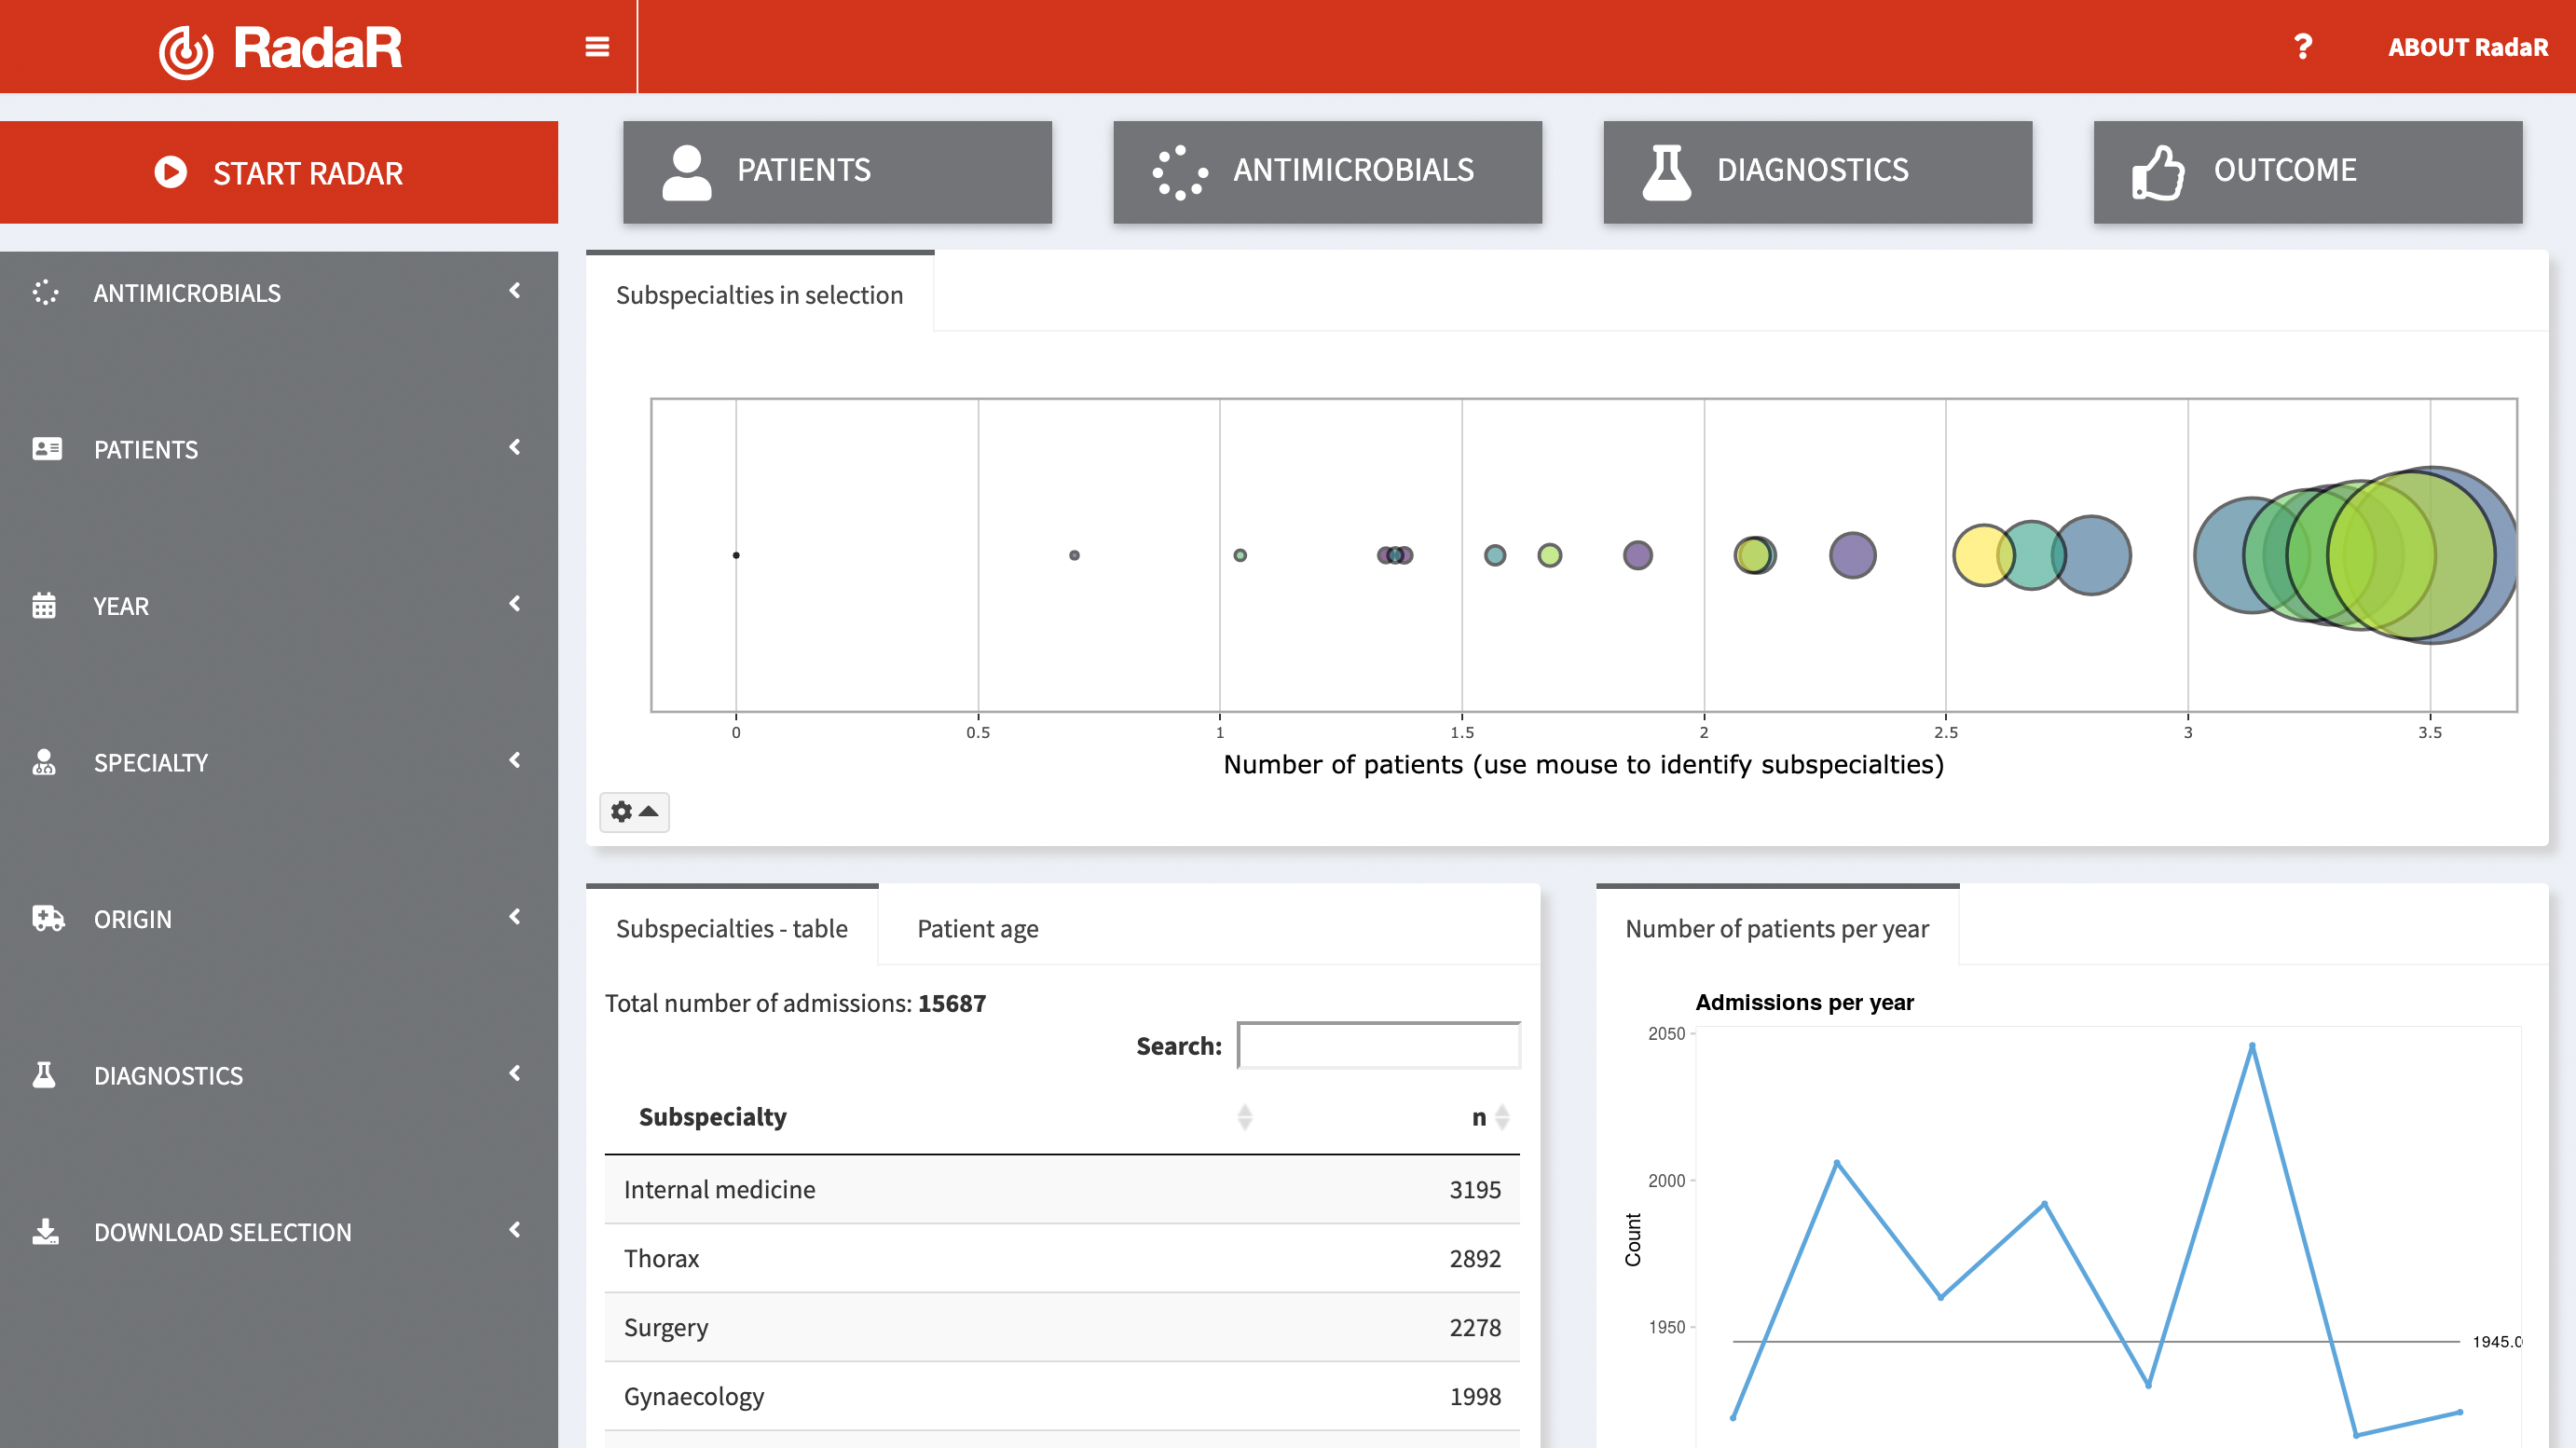
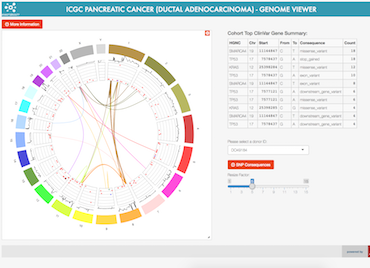
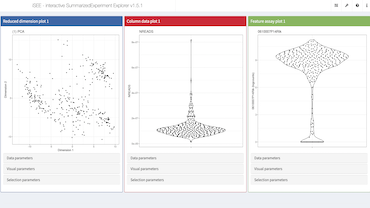
No matching items
Sports

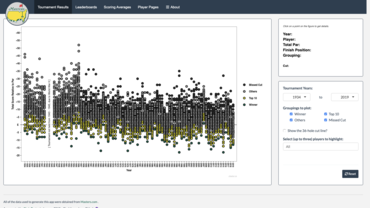
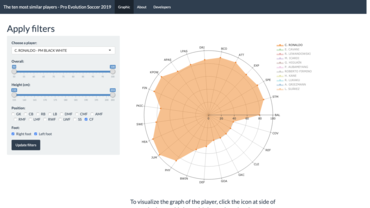
No matching items
Technology


No matching items
Miscellaneous
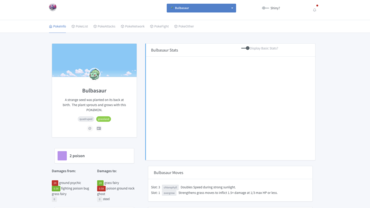
No matching items